Employment, Unemployment and Underemployment
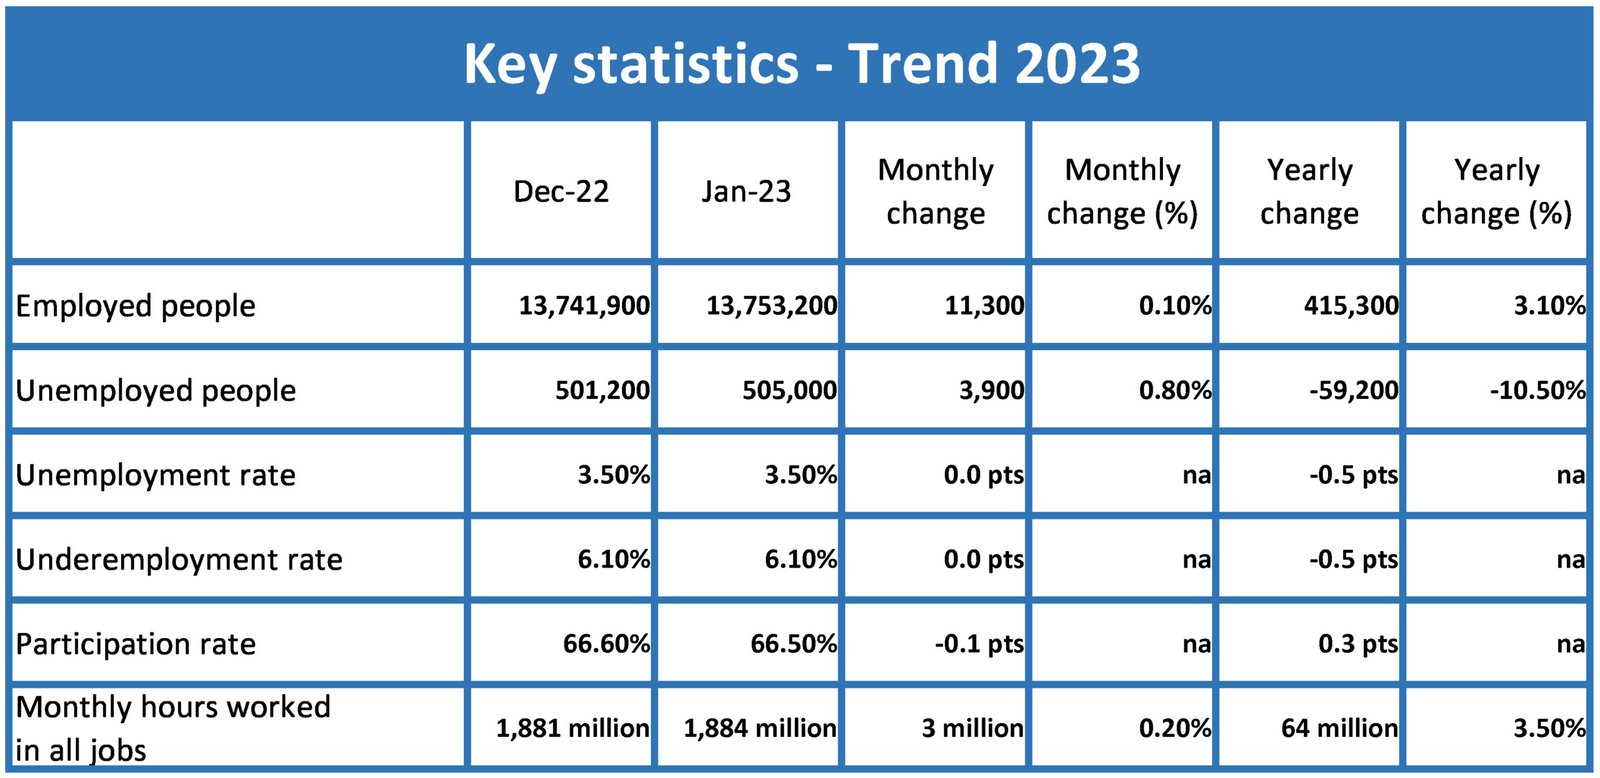
The latest labor force statistics from the Australian Bureau of Statistics (ABS) show that the country’s employment market is continuing to grow, with 13,753,200 people employed in January 2023, a monthly increase of 0.1% or 11,300 jobs. The year-on-year increase is even more impressive, with 415,300 more people employed than in January 2022, a growth rate of 3.1%.
However, the number of unemployed people has also increased slightly, from 501,200 in December 2022 to 505,000 in January 2023, representing a monthly increase of 0.8%. Despite this small increase, the unemployment rate remains at 3.5%, the same as in December 2022. This is still a decrease of 0.5 percentage points compared to the same month last year.
The underemployment rate, which measures the proportion of people who are employed but would like to work more hours, also remained unchanged at 6.1% in January 2023. However, like the unemployment rate, the underemployment rate has decreased by 0.5 percentage points compared to January 2022.
Labour Force Australia Key Stats
Source: Labour Force, Australia
The participation rate, which measures the proportion of people who are either employed or actively looking for work, decreased slightly from 66.6% in December 2022 to 66.5% in January 2023, a change of -0.1 percentage points. However, compared to the same month last year, the participation rate has increased by 0.3 percentage points.
Another positive indicator in the labor force statistics is the monthly hours worked in all jobs, which increased by 0.2% or 3 million hours in January 2023, reaching 1,884 million hours. Compared to the same month last year, this represents an increase of 3.5% or 64 million hours worked.
In summary, the latest labor force statistics from the ABS show a continuing trend of growth in the employment market, with more people employed and more hours worked. While the number of unemployed people has increased slightly, the unemployment rate remains low, and the underemployment rate has also decreased. Overall, these statistics suggest a positive outlook for the Australian labor market.
Age Profile of Australian Labor Force
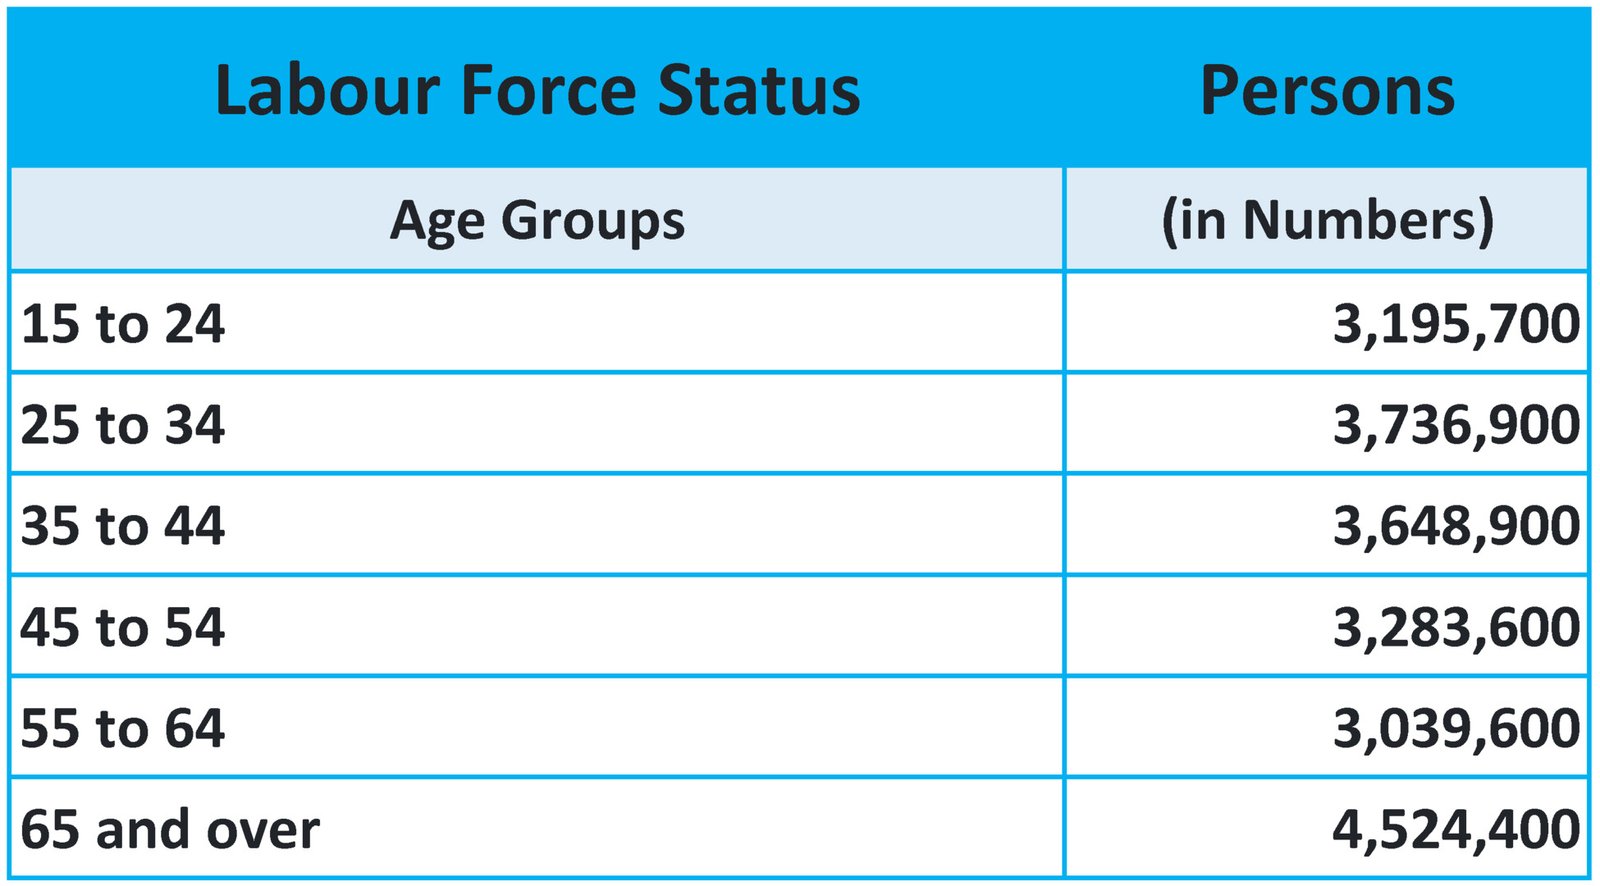
The Workforce Age Profile statistics for January 2023 in Australia provide insight into the distribution of the labor force across different age groups. The data reveals that the largest age group in the workforce is individuals aged 65 and over, with 4,524,400 persons employed. This is followed by the 25 to 34 age group with 3,736,900 employed persons, and the 35 to 44 age group with 3,648,900 employed persons. On the other hand, the smallest age group in the workforce is the 15 to 24 age group, with 3,195,700 persons employed.
Labour Force Australia Age Profile
Source: Labour Force, Australia
The data also shows that the proportion of older workers in the labor force is significant, with the 55 to 64 and 65 and over age groups combined accounting for over 22% of the total employed population. This trend is likely to continue as the population ages, and it has implications for workforce planning and management, including the need for targeted training and development programs for older workers and measures to facilitate their continued participation in the workforce.
Projected Employment Growth by Industry
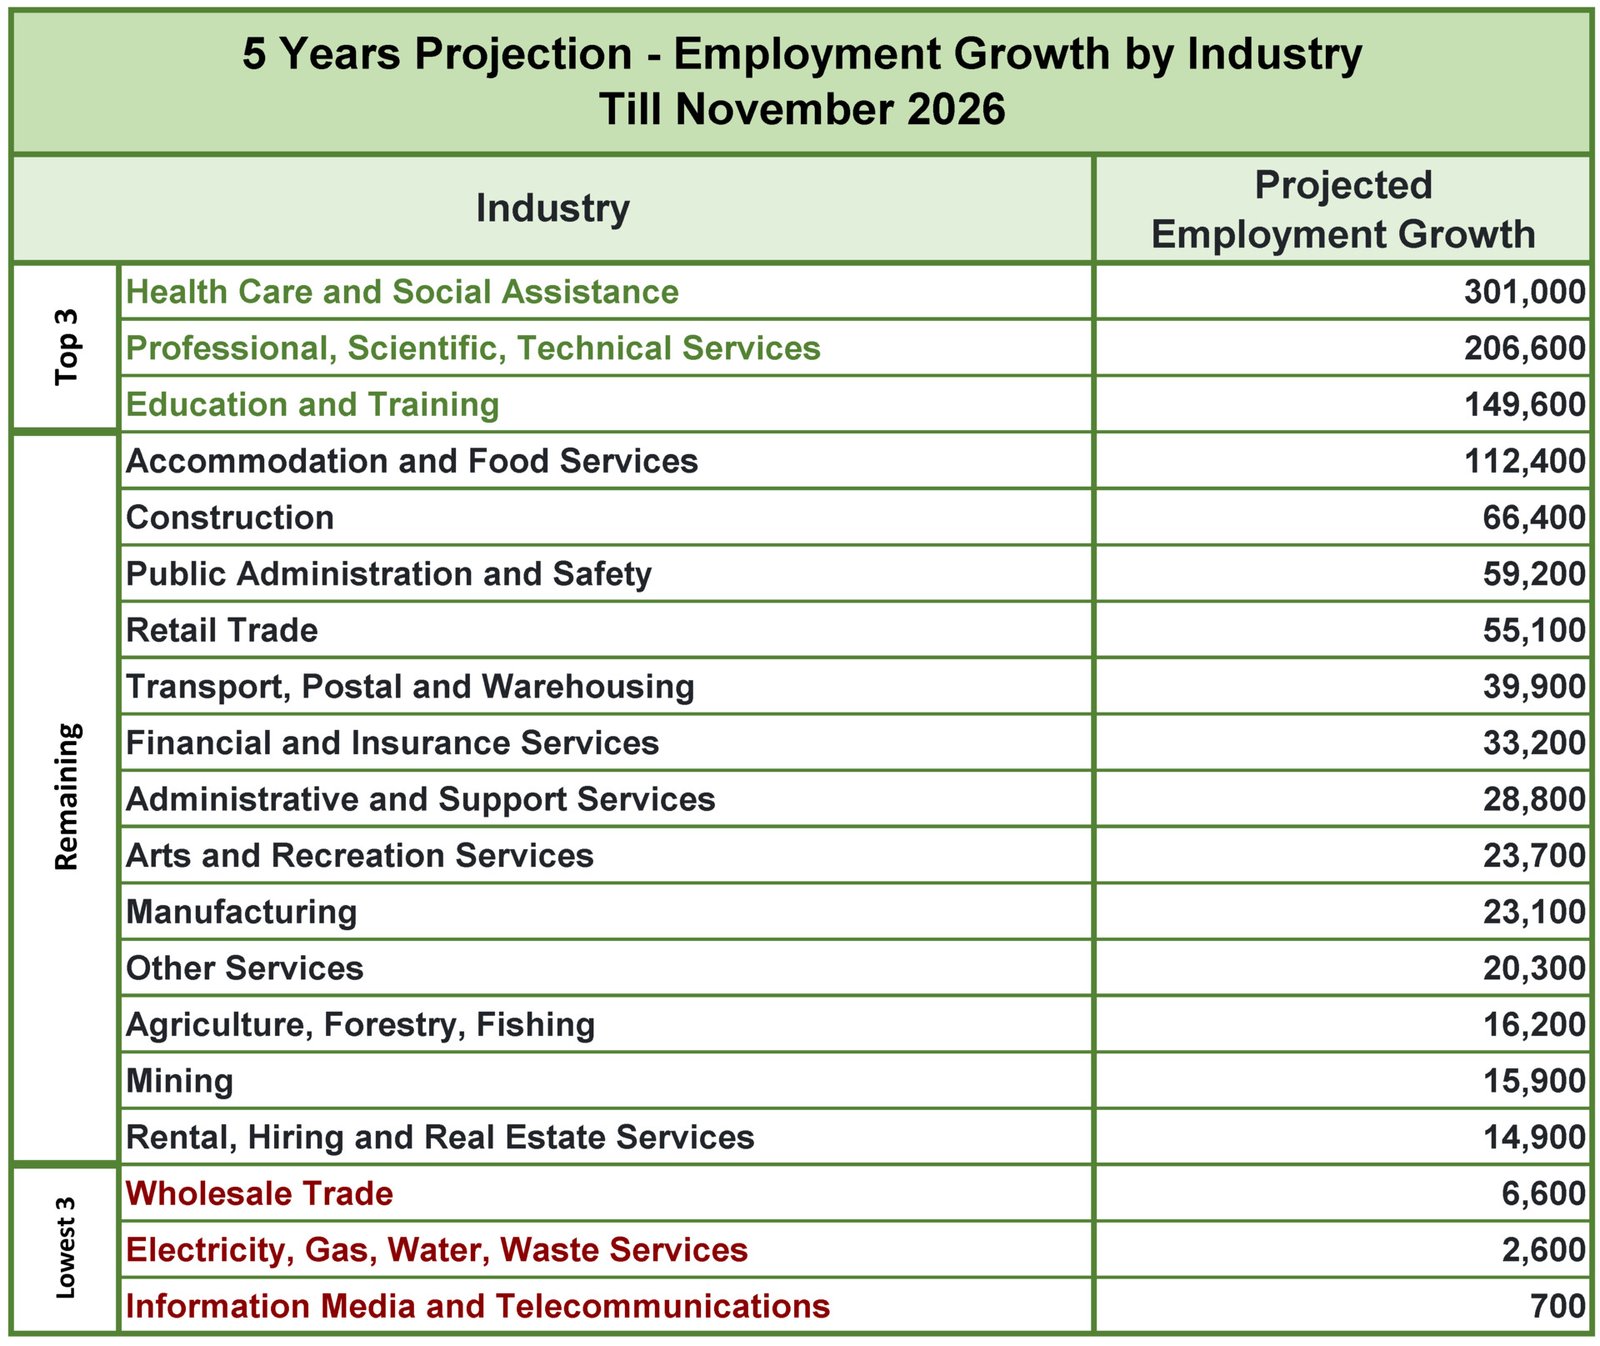
The Jobs and Skills Australia 2021 Employment Projections have forecasted employment growth in Australia by industry for the next five years until November 2026. The top three industries with the highest projected employment growth are Health Care and Social Assistance, Professional, Scientific, Technical Services, and Education and Training, with projected growth of 301,000, 206,600, and 149,600 jobs, respectively. This indicates a continued demand for healthcare services, professional and technical services, and education.
On the other hand, the industries with the lowest projected employment growth are Wholesale Trade, Electricity, Gas, Water, Waste Services, and Information Media and Telecommunications, with projected growth of 6,600, 2,600, and 700 jobs, respectively. This suggests a lower demand for these industries, which may be attributed to technological advancements and changes in consumer behavior.
Employment Growth by Industry
Source: Labour Force, Australia
The Accommodation and Food Services industry is projected to have the fourth-highest employment growth with 112,400 jobs, which indicates a continued demand for tourism and hospitality. The Construction industry is also projected to grow with 66,400 jobs, highlighting continued investments in infrastructure and construction projects. The projections for the Public Administration and Safety industry show growth of 59,200 jobs, indicating continued demand for government services and safety.
Male and Female Employment by Industry
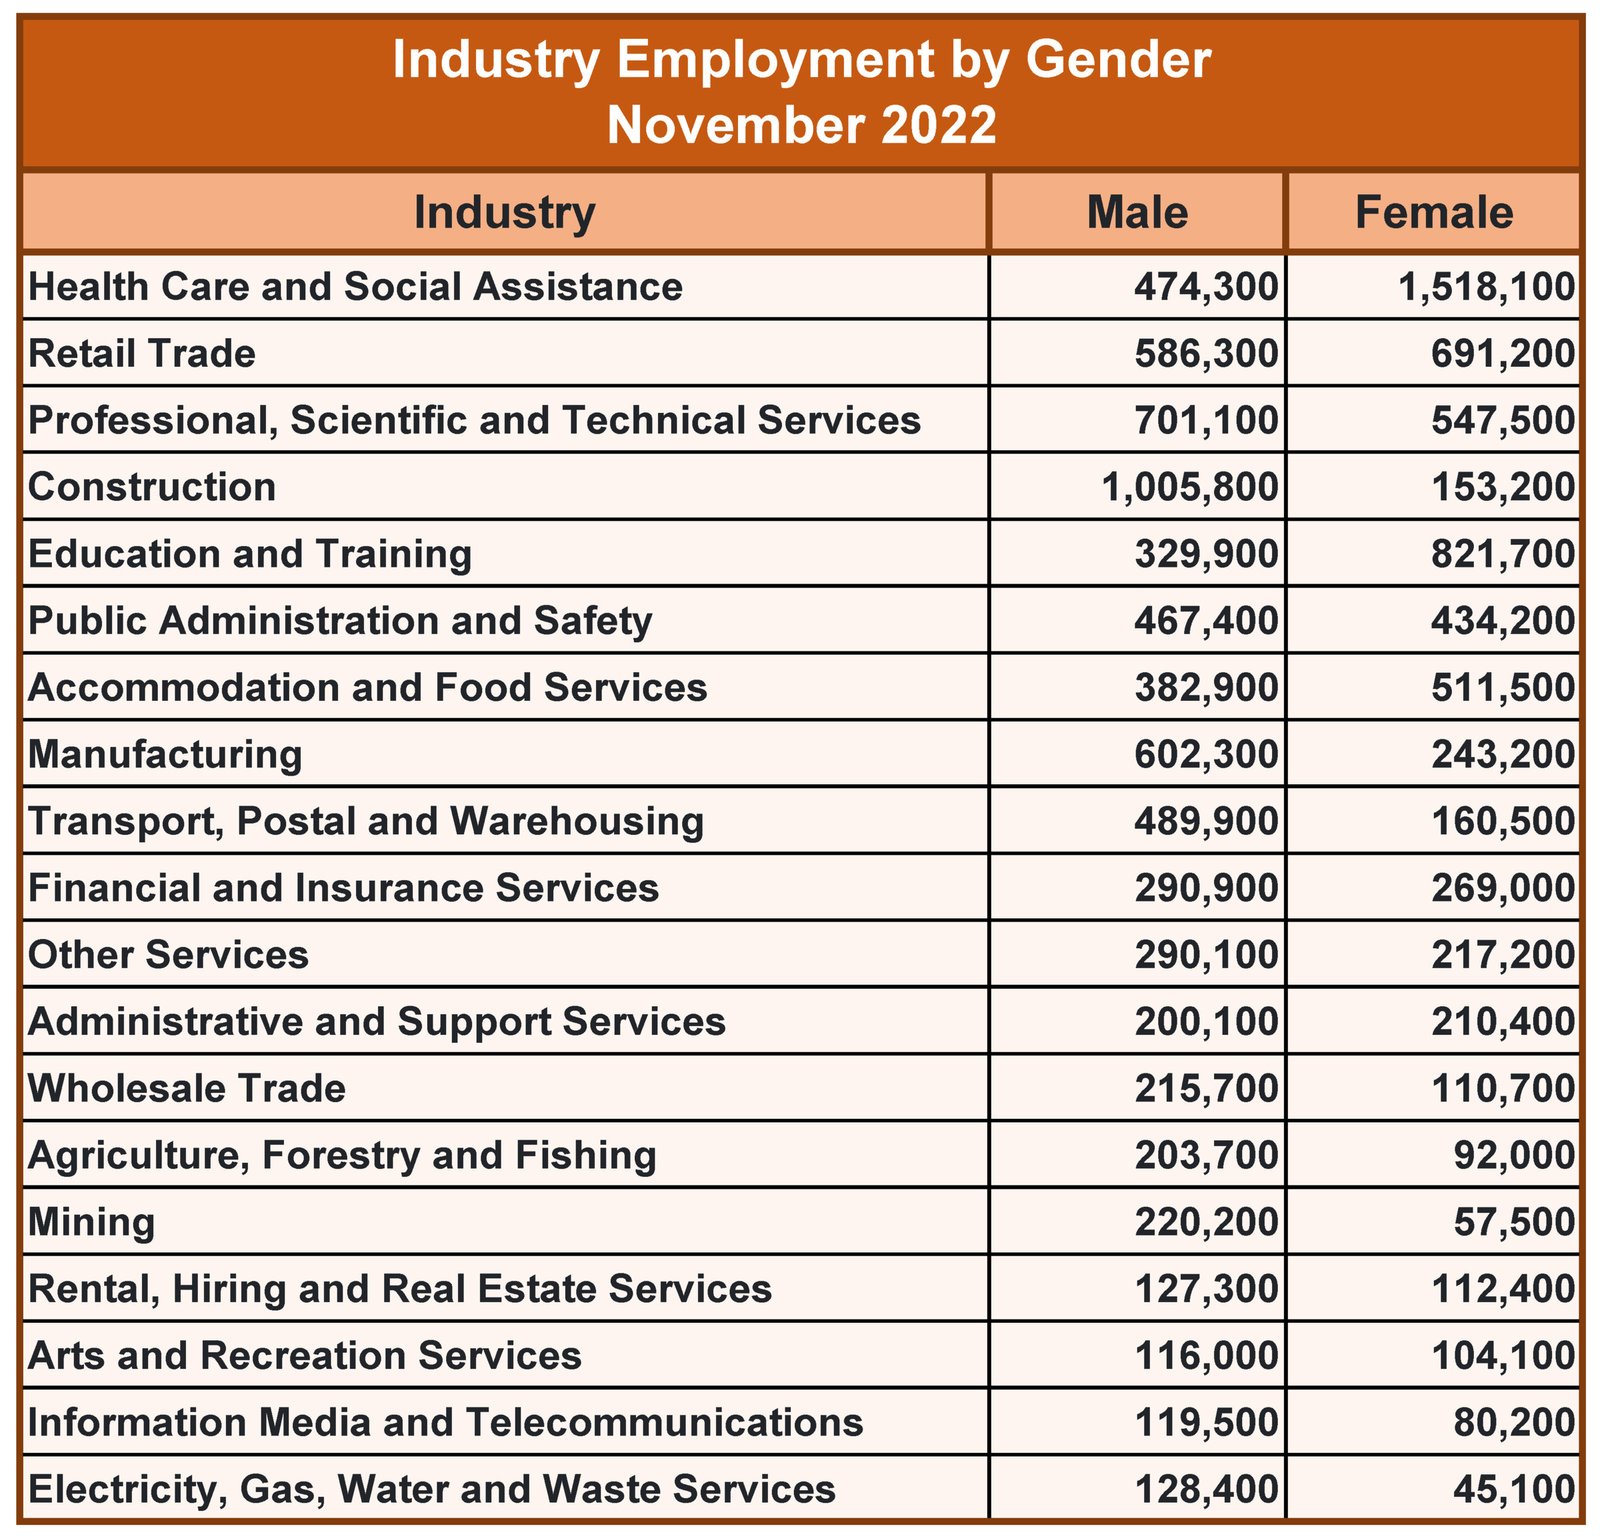
According to the November 2022 data from ABS Labour Force, the three industries with the highest employment in Australia are 1) Health care and Social Assistance, 2) Retail Trade, and 3) Professional, Scientific and Technical services. Health care and Social Assistance employ the highest number of both male and female workers, with figures of 474,300 and 1,518,100 respectively. The retail trade industry employs more male workers with 586,300, while female employment is 691,200. In professional, scientific and technical services, male employment figures are 701,100, while female employment figures are 547,500.
Male & Female Employment by Industry
Source: Labour Market Insights, Australia
On the other hand, the 3 industries with the least employment in Australia are 1) Mining, 2) Electricity, Gas, Water and Waste services, and 3) Information Media and Telecommunications. These industries employ 57,500, 45,100 and 80,200 females respectively, while the male employment figures are 220,200, 128,400, and 119,500 respectively. Mining employs the highest number of male workers, while the electricity, gas, water and waste services industry employs the least number of both male and female workers. The information media and telecommunications industry employs the least number of female workers.
The remaining industries show a relatively even spread of employment between genders, with some industries employing more men than women and vice versa. Education and training, public administration and safety, and accommodation and food services employ a large number of women, while manufacturing, transport, postal and warehousing, and wholesale trade employ a larger number of men. It is worth noting that some industries such as financial and insurance services and information media and telecommunications employ a similar number of both men and women.
Male and Female Employment by Occupation Group
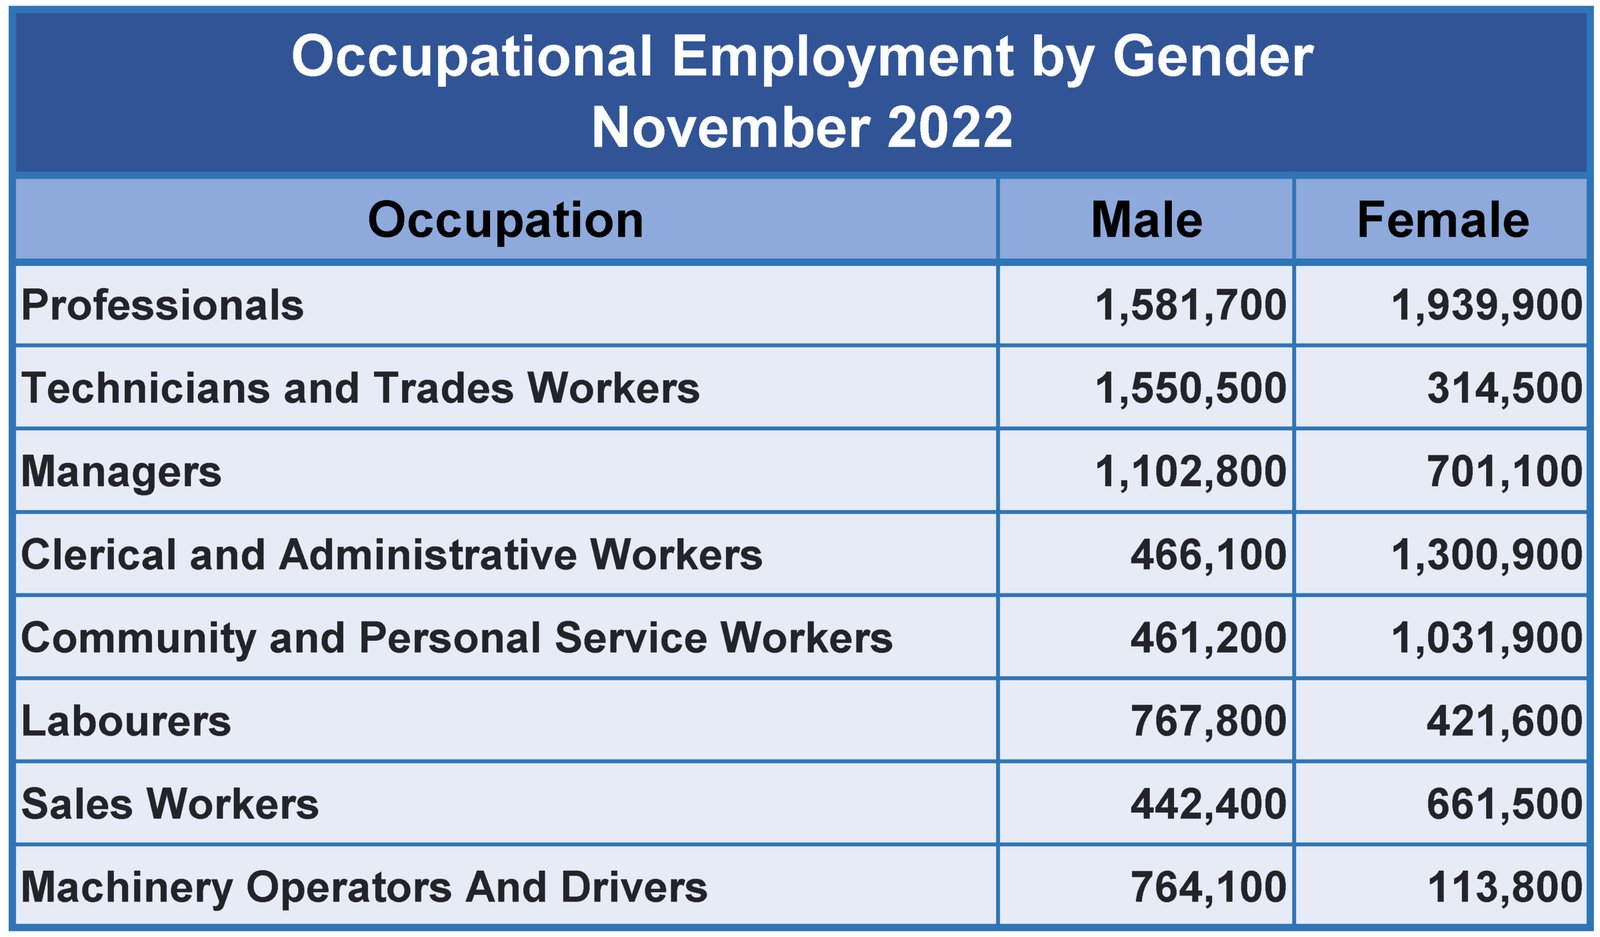
According to the latest data from the Australian Bureau of Statistics, as of November 2022, the largest occupational group in Australia is professionals, comprising 25.9% of the workforce. This category includes occupations such as accountants, engineers, doctors, and lawyers. The second-largest occupational group is managers, comprising 13.2% of the workforce. This category includes positions such as chief executives, general managers, and construction managers.
Male Female Employment by Occupation
Source: Labour Market Insights, Australia
Technicians and trades workers comprise 13.7% of the workforce, while community and personal service workers account for 11% of the workforce. Clerical and administrative workers make up 13% of the workforce, while sales workers account for 8.1%. Machinery operators and drivers represent 6.4% of the workforce, while laborers make up 8.7%. These statistics are important in identifying the main occupational groups in the country and understanding the composition of the workforce in Australia.

